The market for hospitals has grown increasingly concentrated, raising concerns over potential adverse effects on competition. To promote transparency, in April 2022, the Centers for Medicare & Medicaid Services (“CMS”) released, for the first time, data publicly on mergers, acquisitions, and consolidations involving hospitals enrolled in Medicare that occurred on or after January 1, 2016. CMS describes this data as “a powerful new tool for researchers, state and federal enforcement agencies, and the public to better understand the impacts of consolidation on health care prices and quality of care.” In this article, we discuss insights from analysis of this data. The main takeaways are:
- Hospital ownership change has slowed considerably since 2019;
- Acquiring hospitals were larger and more likely to be for-profit; and
- Health system penetration has increased over time.
Overview of Data
When a Medicare-enrolled provider has been purchased (or leased) by another organization, the seller and the buyer must report the transaction to CMS. Ownership is defined broadly by CMS to include “individuals and firms that have operational or managerial control.” The most common type of transaction is Change of Ownership (“CHOW”), in which the seller’s Medicare Identification Number (“MIN”) and provider agreements are transferred to the buyer. If both the buyer and the seller are Medicare-enrolled providers, the transaction is separately categorized as Merger & Acquisition (“M&A”) by CMS. A third type of transaction, Consolidation, has been rare, and none was reported during the analyzed period.
For this analysis, we merged the CMS ownership data (as of Q4 2022) with the 2022 Compendium of U.S. Health Systems and the corresponding hospital linkage files to identify unique transactions. The merged data contains not only transaction-level details such as transaction type and effective date, but also characteristics of hospitals—and the health systems they are part of— such as location, bed count, discharges, and revenue.
Change of Ownership Transactions Have Slowed Considerably Since 2019
There were 341 unique hospital ownership transactions that occurred between 2016 and 2022, of which 285 classified were CHOW transactions and 56 were M&A deals. As depicted in Figure 1, the volume of transactions more than doubled from 40 in 2016 to 91 in 2019. That means, in 2019, one in every 68 hospitals changed hands. Since then, the pace of transactions has slowed down considerably—only 12 transactions were recorded in 2022.
Figure 1: Change of Ownership Transactions by Year, 2016-2022
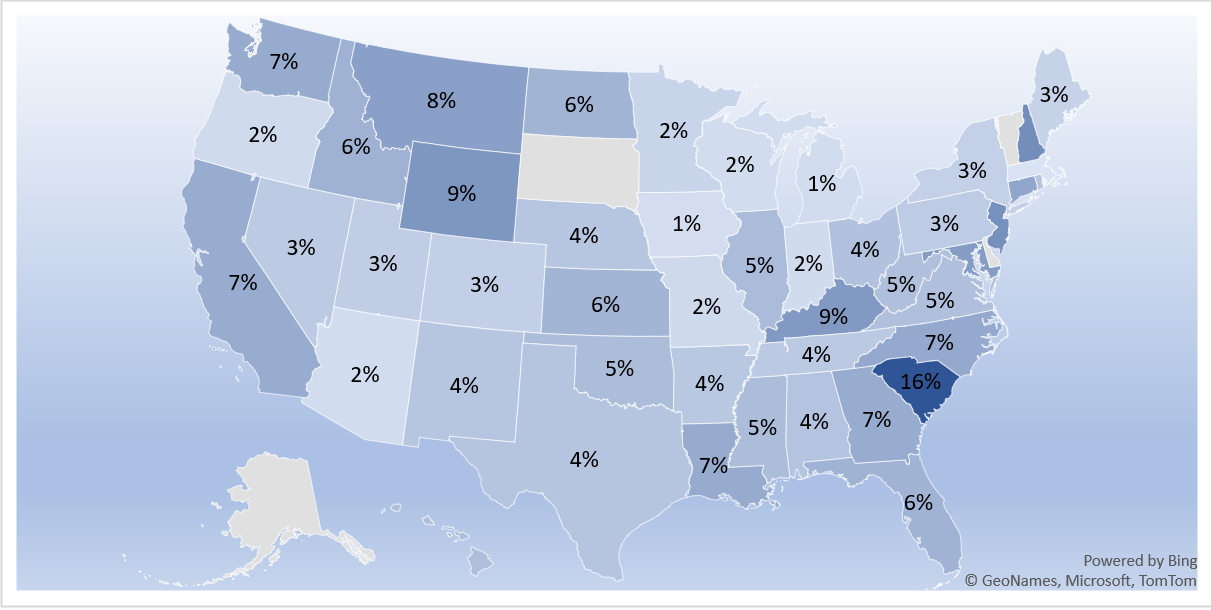
Unsurprisingly, more transactions took place in larger states like California, Texas, and Florida. To account for differences in population size, we ranked states by their hospital turnover rate, calculated as the ratio of transaction volume to the number of Medicare-enrolled hospitals. By this measure, South Carolina was head-and-shoulder above everyone else, as shown in Figure 2. Cumulatively, nearly one in six hospitals were sold from 2016 to 2022. This momentum seemed to carry over to 2023, as Tenet Health announced a deal with Novant Health to sell three South Carolina hospitals for $2.4 billion. Other states with a notably high hospital turnover rate include New Hampshire, New Jersey, Wyoming, and Kentucky. In contrast, few hospitals changed hands in states like Massachusetts, Iowa, and Michigan, where the turnover rate hovered around just one percent.
Figure 2: Hospital Turnover Rate by State, 2016-2022
Acquiring Hospitals Were Larger and More Likely to be For-Profit
The acquiring hospitals (i.e., identified as buyers in CMS’s transaction data) were nothing like the average hospital. See Table 1. For one, the acquiring hospitals were nearly twice as large as the average hospital, whether measured by the number of beds, patient discharges, or net patient revenue. Moreover, the acquiring hospitals were also more likely to be for-profit or investors-owned, though they are equally as likely to be non-profit. Select indicators of patient demographics also suggest that the acquiring hospitals were more likely to serve a higher proportion of low-income patients.
Table 1: Comparison of Select Hospital Characteristics
|
All Hospitals |
Acquiring Hospitals |
|
|
No. of Hospitals |
6,764 |
341 |
|
Hospital Size |
||
|
Median No. of Beds |
65 |
102 |
|
Median No. of Discharges |
1,568 |
3,337 |
|
Median Net Revenue (Million USD) |
$63.2 |
$96.3 |
|
Hospital Ownership |
||
|
Is Nonprofit |
34.8% |
36.3% |
|
Is For-Profit/Investors Owned |
25.0% |
34.7% |
|
Patient Socio-Economic Indicators |
||
|
Has High Uncompensated Care Burden |
12.4% |
17.9% |
|
Has High DSH Patient Percentage |
8.3% |
14.1% |
Health System Penetration Has Increased Over Time
Penetration by health systems has increased over time. Figure 3 compares heath system penetration between 2016 and 2022. In 2016, 70 percent of non-federal acute care hospitals, 88 percent of hospital beds, and 45 percent of physicians were part of a health system. By 2022, 630 health systems commanded 76 percent of all non-federal acute care hospitals, collectively owning 93 percent of all hospital beds and employing 67 percent of physicians.
Figure 3: Share of Hospitals, Beds, and Physicians in Health Systems, 2016 and 2022
The most active health system, as measured by the number of transactions in which they were the acquiring entity, was CommonSpirit Health. Created in 2019 through a $30 billion merger of Catholic Health Initiatives and Dignity Health, CommonSpirit Health purchased 15 hospitals between 2016 and 2022. HCA Healthcare was a close second with 14 transactions. Collectively, the top ten most active health systems accounted for 27 percent of all transactions.
A full detailed version of this article, with citations, is available at the link below. For additional inquiries, please contact info@vegaeconomics.com.


