In the decade following the onset of the 2008 financial crisis, U.S. corporate debt has experienced a period of strong growth and as of 2019 stands at over $9.5 trillion – more than 45 percent of U.S. GDP. This article discusses three notable trends in the corporate bond market since the financial crisis: (1) the rise in corporate debt, (2) the increased risk profile of new corporate debt, and (3) an increased risk premium during the COVID-19 pandemic.
Strong Growth in Corporate Debt Since the 2008 Financial Crisis
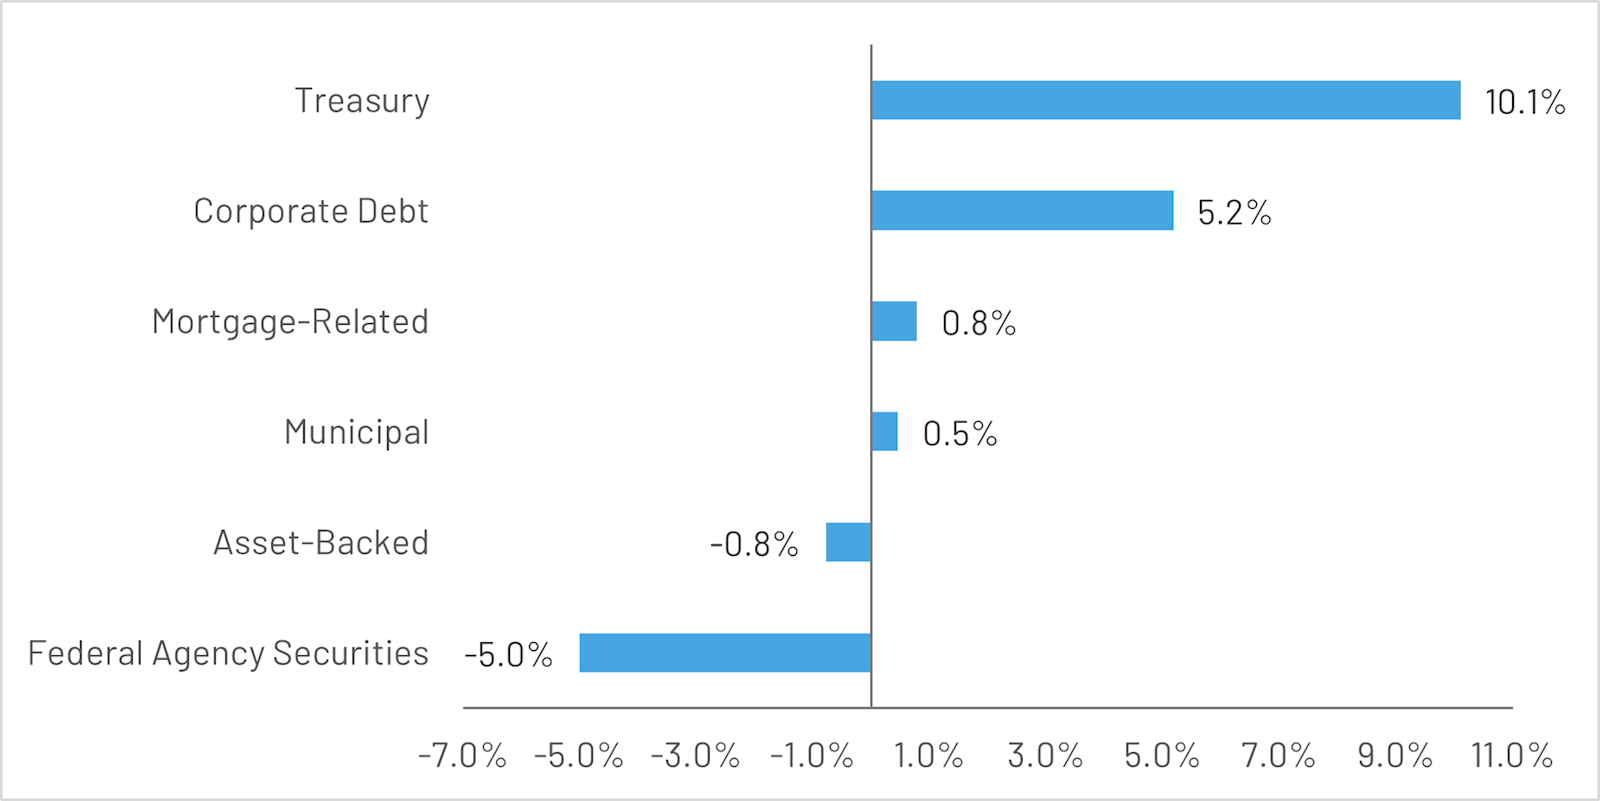
In 2008, the corporate bond market added $758 billion in new issues, half of the amount of mortgage-related securities issued that year. But over the next 10 years, annual issuance of new corporate bonds averaged $1.3 trillion. As seen in Figure 1: Annualized Growth Rate of Fixed Income Securities (2008-2019), total outstanding corporate debt grew at an annualized rate of 5.2 percent, second only to issuance of treasuries.
Figure 1: Annualized Growth Rate of Fixed Income Securities (2008-2019)
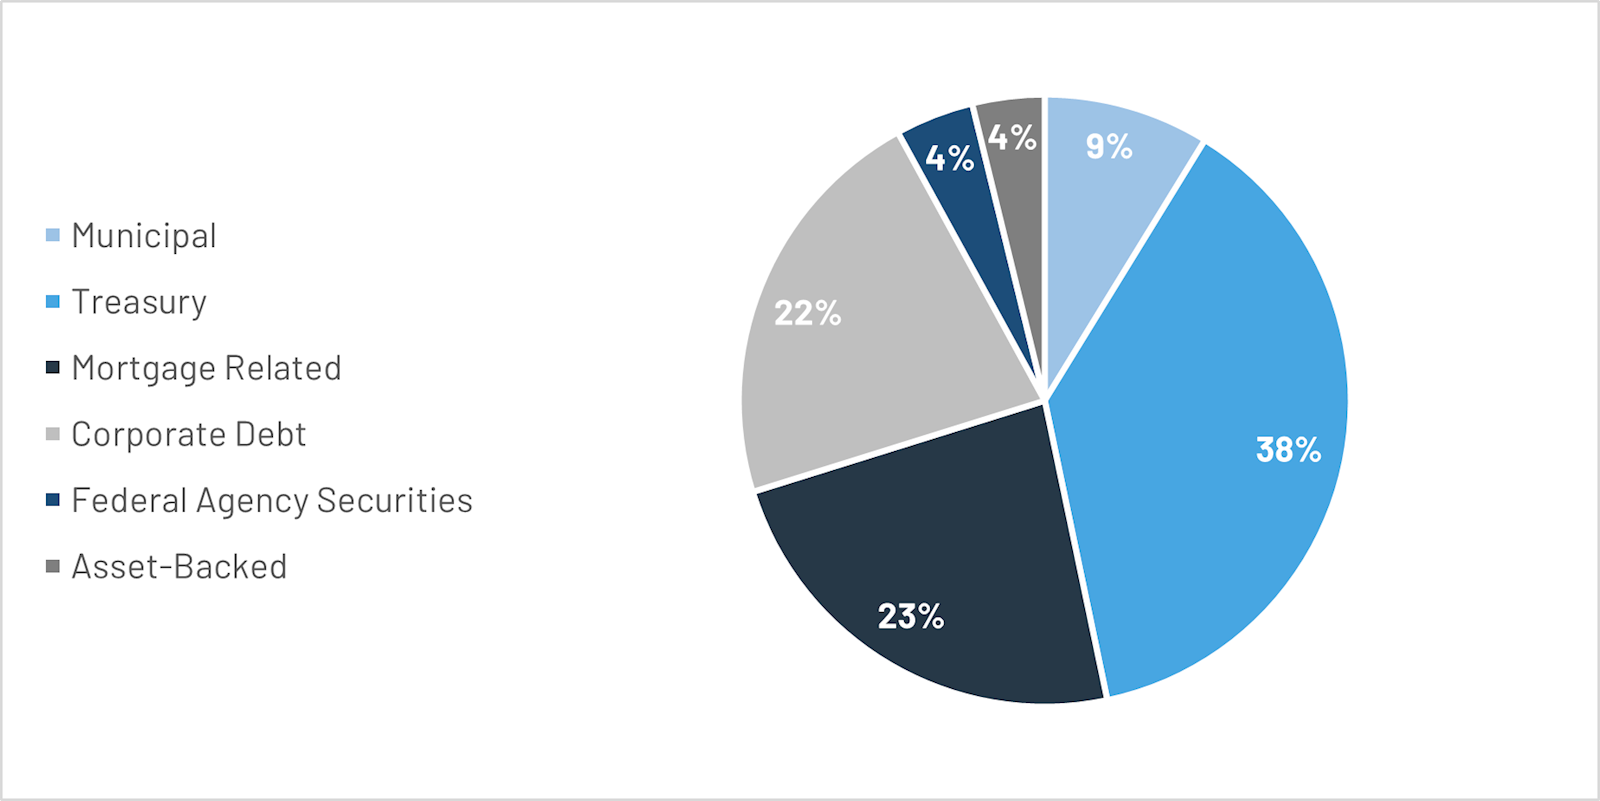
Indeed, over this period, corporate debt increased its share of total outstanding fixed income securities from 18 percent to 21 percent. Figure 2: Share of Outstanding Fixed Income Securities (2019) shows that in 2019 outstanding corporate debt rivaled that of mortgage-related securities.
Figure 2: Share of Outstanding Fixed Income Securities (2019)
Increased Risk Profile of New Corporate Bond Issuance
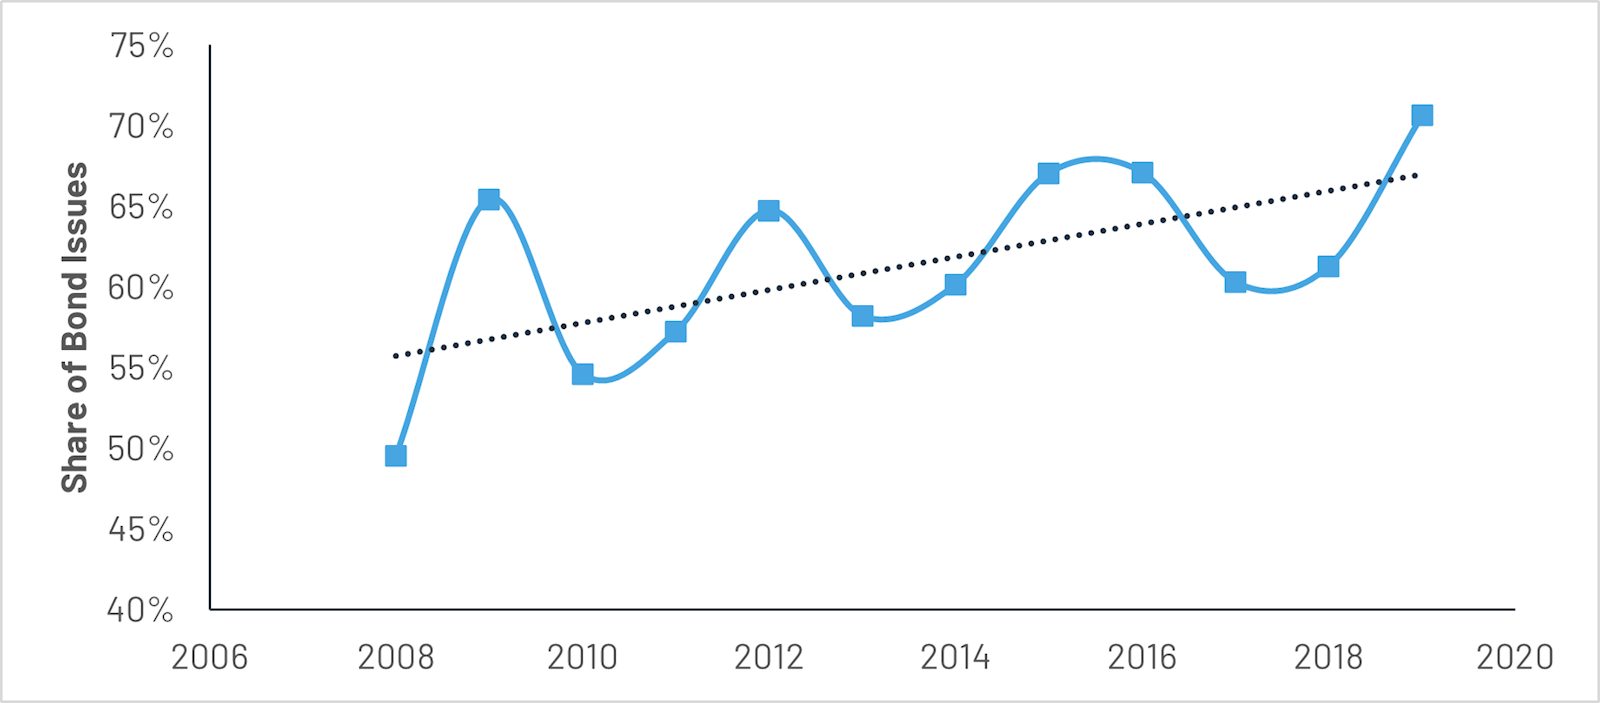
New corporate bonds issued after the financial crisis are considerably riskier to investors. First, Figure 3: Callable Bond as Share of Total Issues shows a rise in callable bonds, which were less than half of new issuance in 2008, to over 70 percent of new corporate debt issuance in 2019. Issuers can redeem callable bonds before maturity and often do so when market interest rates are falling. These securities thus reduce financing cost for firms but also increase uncertainty and risk for investors.
Figure 3: Callable Bond as Share of Total Issues
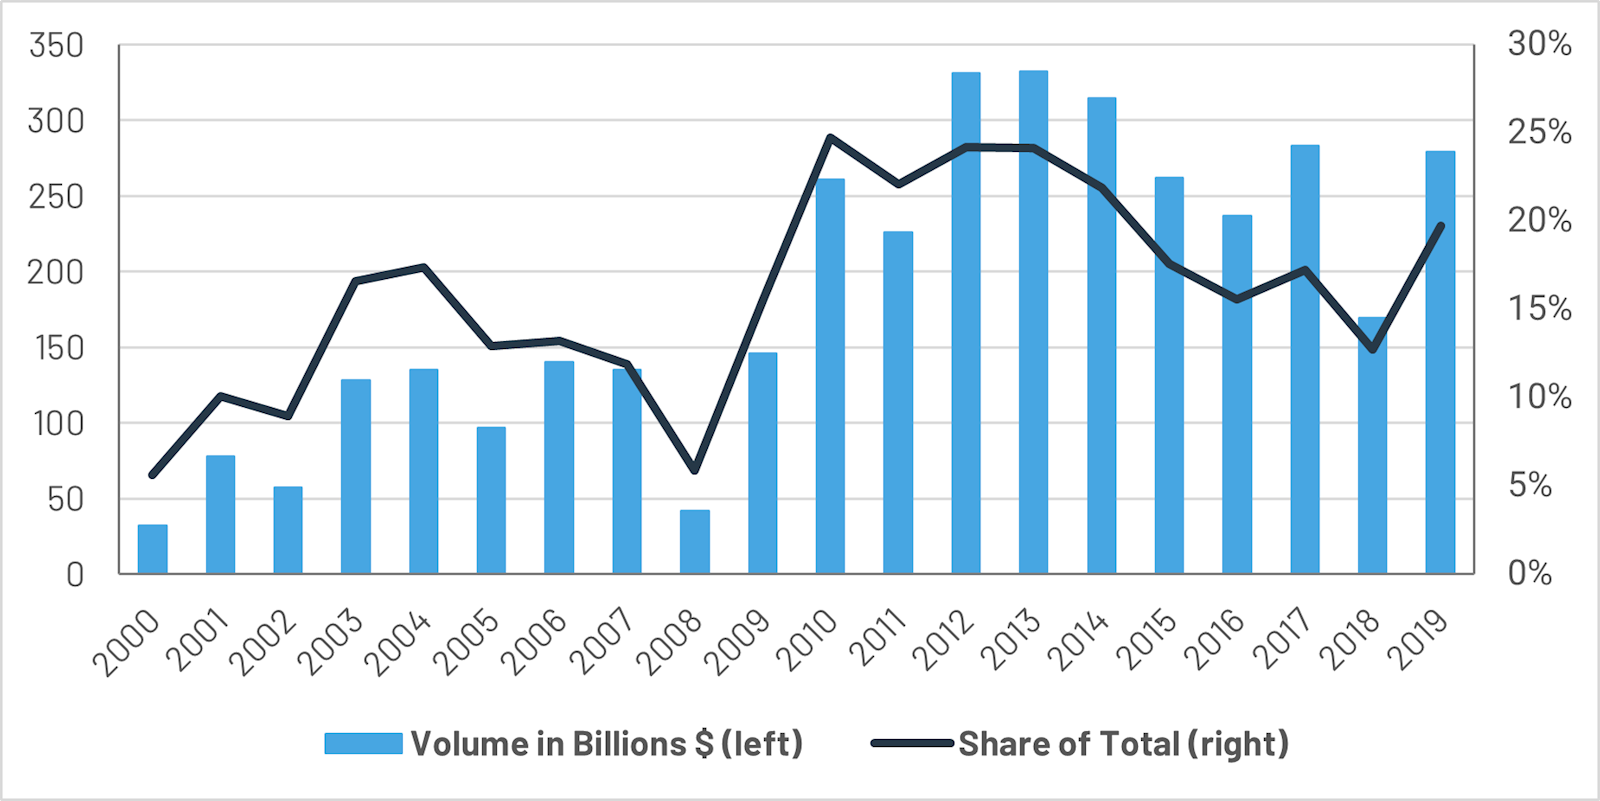
Additionally, high-yield bonds (also called “junk bonds” or “speculative-grade bonds”) represent a higher share of new issuance after the financial crisis. These bonds pay higher interest rates but have lower credit ratings. Figure 4: High-yield Corporate Bond Issuance indicates an uptick in high-yield bonds starting in 2008, with the volume of issuance quadrupling in the next two years. The recovery of the economy in subsequent years partially reversed this trend, but the fraction of high-yield bonds remains higher today than any time pre-crisis.
Figure 4: High-yield Corporate Bond Issuance
Finally, reduced liquidity in the secondary market since the financial crisis adds another layer of risk to high-yield bonds. To see this, consider the volume of trades divided by the volume of issuance as a simple measure of market liquidity. This metric approximates the likelihood that newly issued corporate bonds will be traded on any day. Table 1: Likelihood of Trade shows that for high-yield bonds, this ratio fell to nearly half its pre-2008 level, indicating a substantial reduction in liquidity of secondary trading market.
Table 1: Likelihood of Trade
|
Investment-Grade |
High-Yield |
|
|
Pre-2008 |
0.02 |
0.07 |
|
Post-2008 |
0.02 |
0.04 |
|
Net Change |
(0.00) |
(0.03) |
Impact of the COVID-19 Pandemic
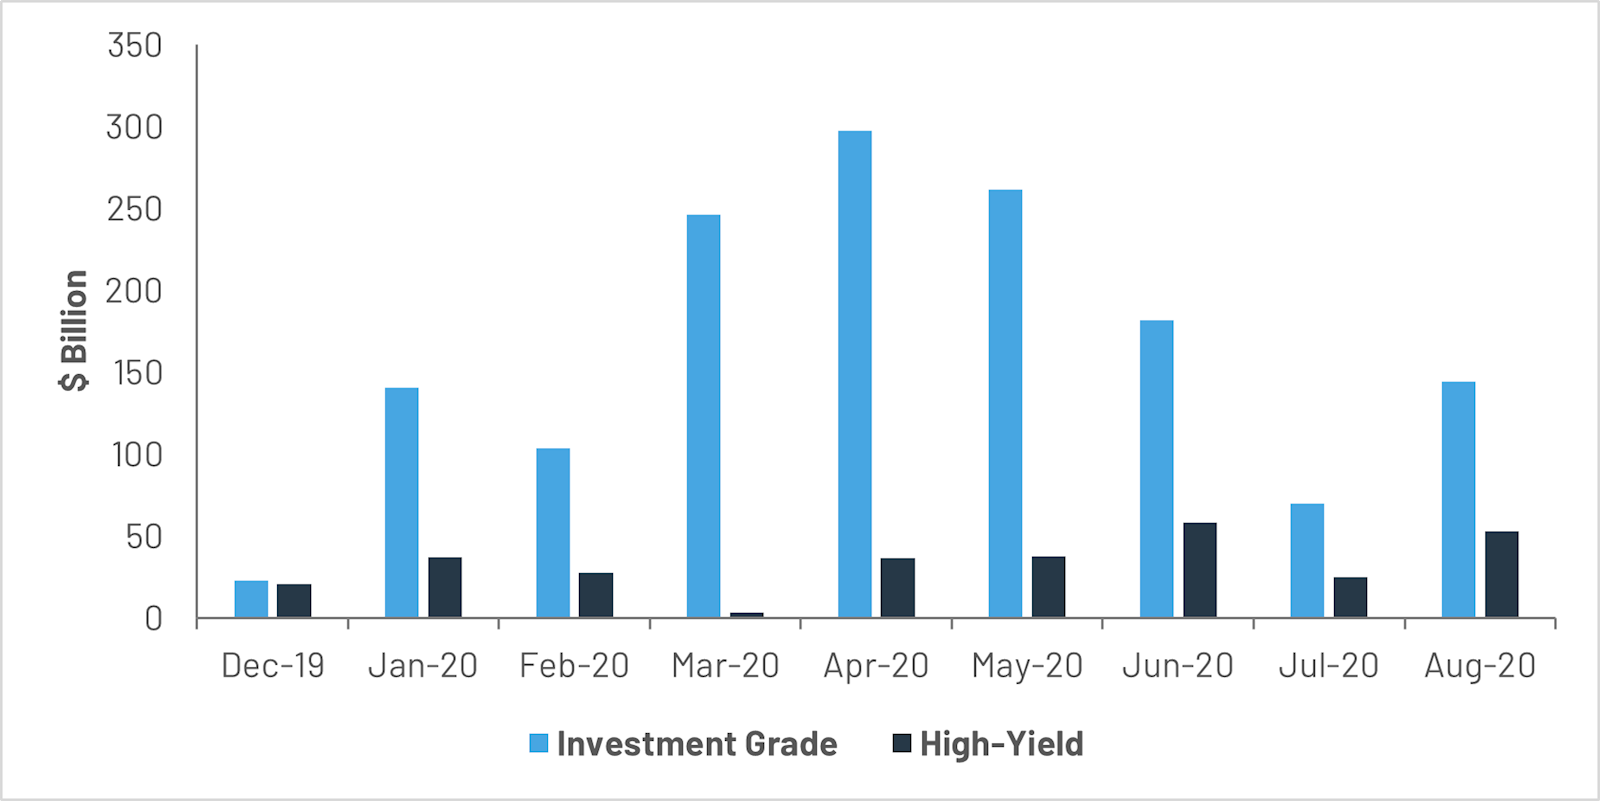
The COVID-19 pandemic shook the U.S. economy and the financial market in unprecedented ways. The corporate bond market was no exception. In the first quarter of 2020, there was a notable but modest increase in monthly issuance as companies scraped for cash. But after March 2020, the market saw corporate bond issuance surge in months. Figure 5: Monthly Corporate Bond Issuance During COVID-19 Pandemic shows that investment-grade bonds reached a record $300 billion in new issuance in April 2020 alone. For high-yield bonds, that historic moment came in June with over $58 billion in new issuance.
Figure 5: Monthly Corporate Bond Issuance During COVID-19 Pandemic
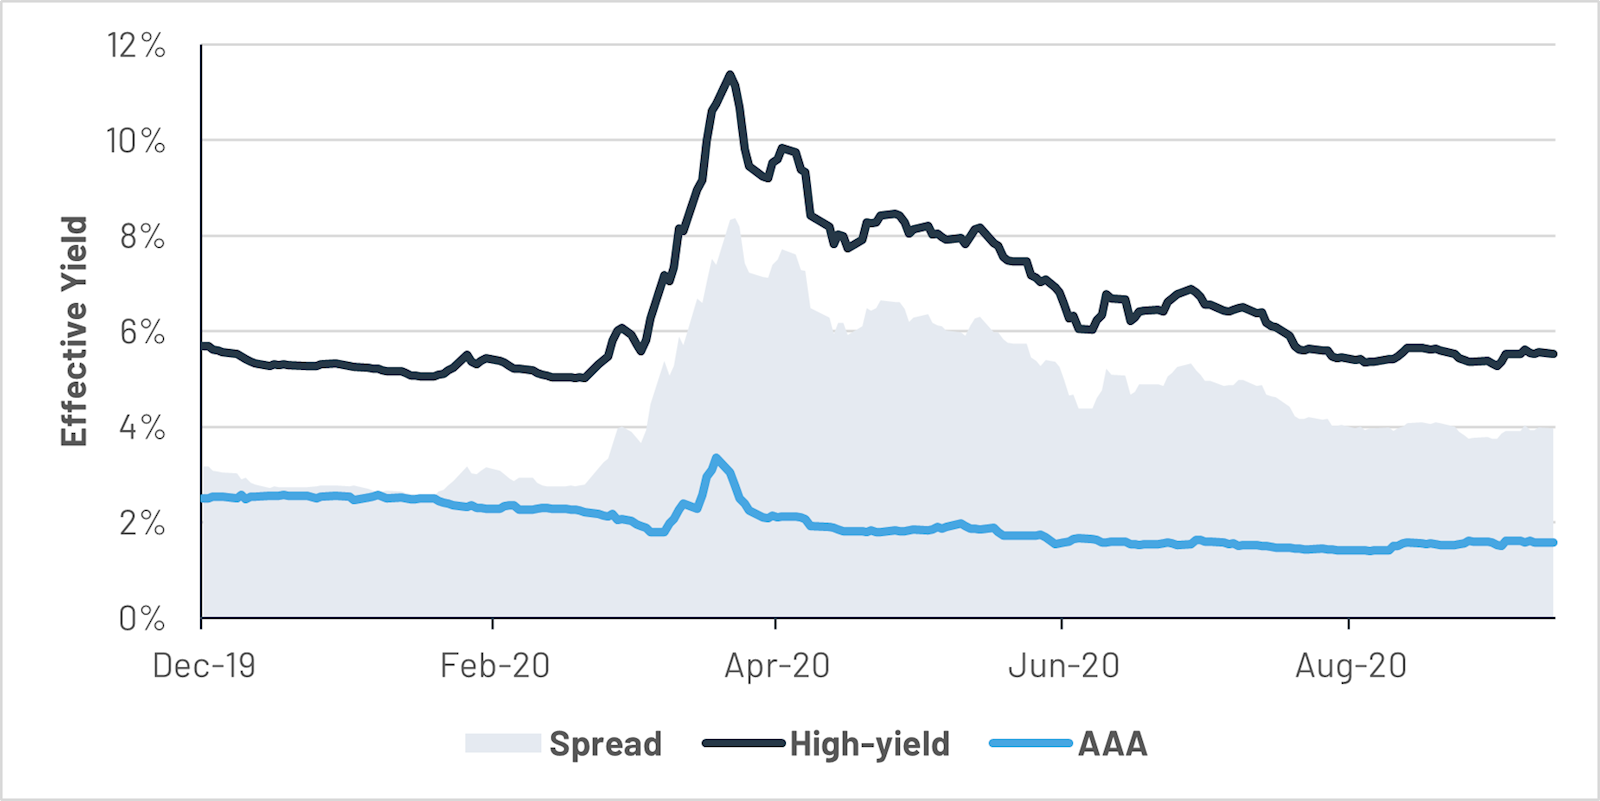
The COVID-19 pandemic has also impacted yields of corporate bonds, particularly high-yield bonds. As Figure 6: Effective Bond Yields shows, both yields surged in March 2020. The yield of AAA corporate bonds quickly returned to pre-pandemic levels and then dipped even lower. The yield of high-yield bonds, on the other hand, remains higher than early 2020 levels. As a result, the yield spreads between AAA and high-yield corporate bonds have increased during the COVID-19 pandemic, going from two percent in the first quarter of 2020 to four percent throughout the third quarter of 2020. The market appears to have placed a higher price tag on the additional risks borne by high-yield bonds.
Figure 6: Effective Bond Yields
Market observers are also predicting an increasing default rate for high-yield bonds. According to a Moody’s report, the default rate for high-yield U.S. corporate bonds climbed from 2.4 percent in August 2019 to 6.2 percent in July 2020. Standard & Poor’s predicts in a recent report that 12.5 percent of high-yield corporate bonds will default by March 2021.
For inquiries regarding this article, please contact info@vegaeconomics.com.
![]() Trends in the U.S. Corporate Bond Market Since the Financial Crisis
Trends in the U.S. Corporate Bond Market Since the Financial Crisis

